
III-CA: Earnings Analysis: Q2, 2016 By the Numbers : August 19, 2016
posted on
Aug 19, 2016 11:07AM

Discover - Develop - Operate

Imperial Metals Corp. reports financial results for the quarter ended June 30, 2016.
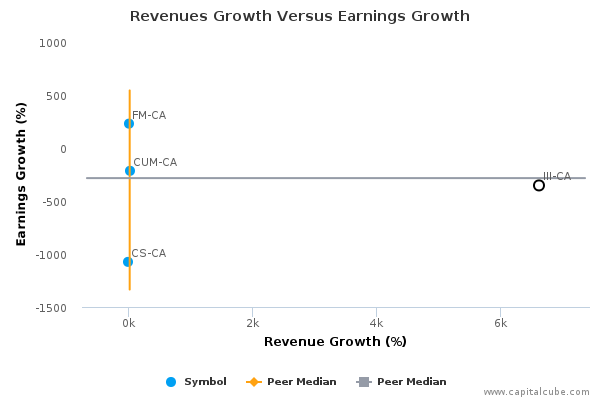
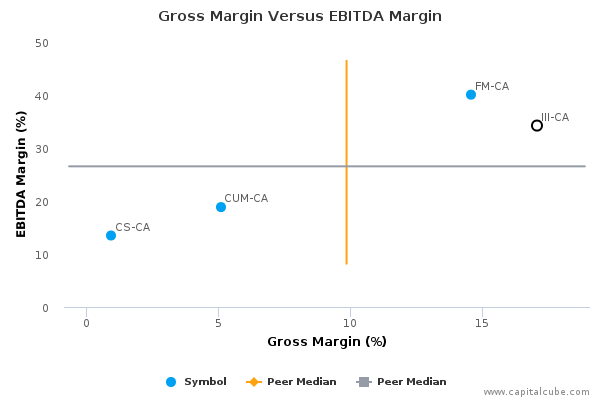
We analyze the earnings along side the following peers of Imperial Metals Corp. – Copper Mountain Mining Corporation, Capstone Mining Corp. and First Quantum Minerals Ltd. (CUM-CA, CS-CA and FM-CA) that have also reported for this period.
The table below shows the preliminary results and recent trends for key metrics such as revenues and net income growth:
| Revenues (mil) | 1.73 | 55.93 | 69.51 | 136.79 | 116.2 |
| Revenue Growth (%YOY) | -96.62 | 146.74 | 1090.1 | 8822.7 | 6632.33 |
| Earnings (mil) | 1.64 | -29.34 | -35.88 | 17.73 | -4.16 |
| Earnings Growth (%YOY) | -89.19 | 40.38 | -292.79 | 153.11 | -353.04 |
| Net Margin (%) | 95.25 | -52.47 | -51.61 | 12.96 | -3.58 |
| EPS | 0.02 | -0.37 | -0.44 | 0.22 | -0.05 |
| Return on Equity (%) | 1.84 | -31.59 | -39 | 19.76 | -4.55 |
| Return on Assets (%) | 0.46 | -8.05 | -9.71 | 4.84 | -1.15 |
Access our Ratings and Scores for Imperial Metals Corp.
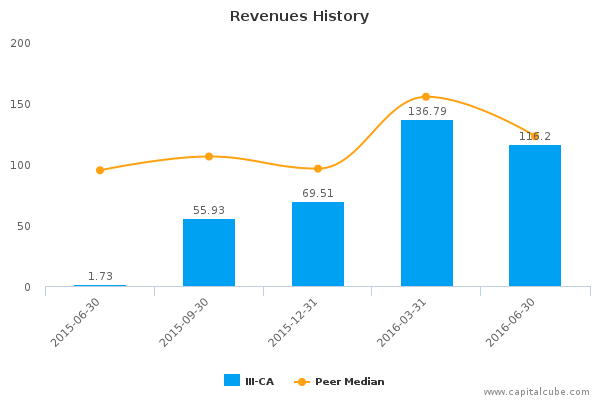
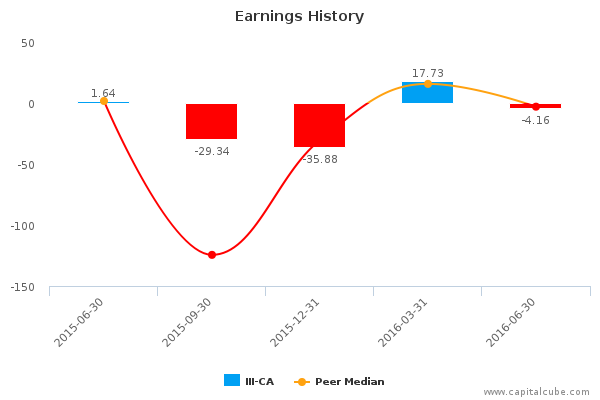
III-CA‘s change in revenue this period compared to the same period last year of 6,632.33% is almost the same as its change in earnings, and is about average among the announced results thus far in its peer group, suggesting that III-CA is holding onto its market share. Also, for comparison purposes, revenues changed by -15.05% and earnings by -123.46% compared to the immediate last period.
The company’s year-on-year earnings decline did not come as a result of a contraction in gross margins or because of any cost control issues. Both gross margins and operating margins (EBITDA) margins actually improved over this time frame. Gross margins went from -195.19% to 17.08%, while operating margins improved from -168.83% to 34.23% over this period. For comparison, gross margins were 14.58% and EBITDA margins 31.47% in the immediate last period.
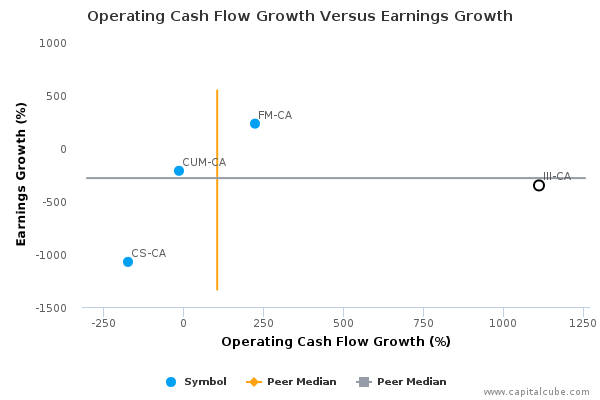
III-CA‘s change in operating cash flow of 1,112.71% compared to the same period last year is about the same as its change in earnings this period. Additionally, this change in operating cash flow is about average among its peer group. This suggests that the company did not use accruals or reserves to manage earnings this period, and that, all else being equal, the earnings number is sustainable.
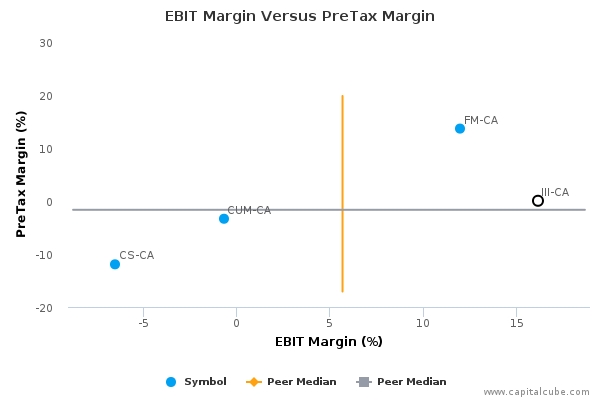
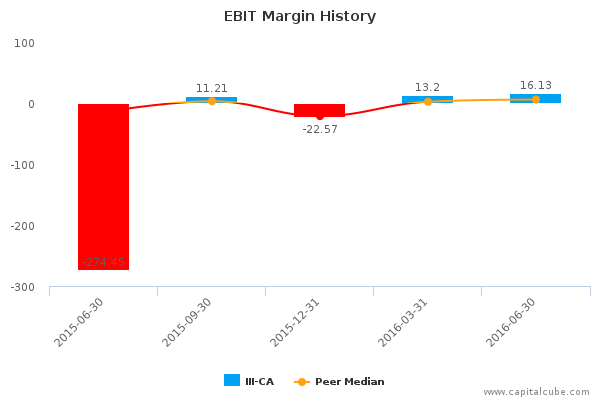
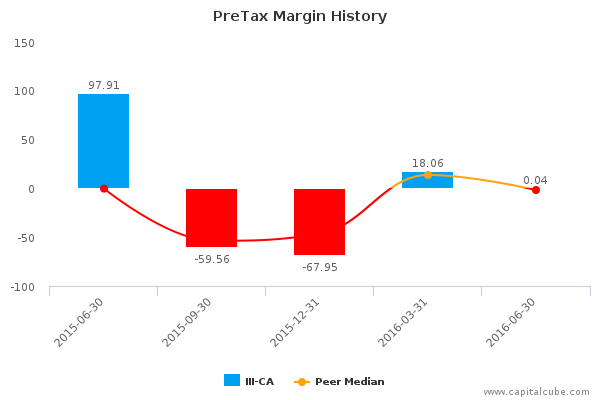
Despite an overall improvement in operating (EBIT) margins, the company’s earnings fell. EBIT margins went from -274.45% to 16.13%. The decline in earnings appears to be largely because of one-time items. Pretax margins declined from 97.91% to 0.04%.
Access our Ratings and Scores for Imperial Metals Corp.
Imperial Metals Corp. is a Canadian mining company, which acquires, explores, develops and produces base and precious metals from its mineral properties. The company operates its business through four segments: Mount Polley, Red Chris, Huckleberry and Sterling. Its key properties are two open pit mines: Mount Polley copper or gold mine, Huckleberry copper or molybdenum mine, both in British Columbia, as well as Red Chris copper or gold property in British Columbia and Sterling gold property in Nevada. Imperial Metals was founded on December 6, 2001 and is headquartered in Vancouver, Canada.
CapitalCube does not own any shares in the stocks mentioned and focuses solely on providing unique fundamental research and analysis on approximately 50,000 stocks and ETFs globally. Try any of our analysis, screener or portfolio premium services free for 7 days. To get a quick preview of our services, check out our free quick summary analysis of III-CA.